Chewy's IPO: Customer Analytics and Valuation using Probability Models
Chewy, Inc., the pure-play online pet retailer, IPO’d on June 14, 2019 at a $9.3 billion valuation. With its S-1 filing, Chewy provided limited - but just enough - disclosure on its customers to allow for a rich analysis of customer acquisition, retention, and economics. Utilizing probability models and methodology based on Customer-Based Corporate Valuation1, this report provides a unique analysis of Chewy’s customer dynamics, economics, and valuation.
Key insights:
- Customer acquisition likely peaked in 2018, despite increasing marketing spend as Chewy hits the inflection point with new customer acquisition decelerating going forward.
- Chewy loses approximately 40% of new customers after one year, stabilizing thereafter.
- Slowing, but still meaningful growth in active customers ahead. Active customers is projected to grow by 27% in 2019 and 16% in 2020.
- Customer Acquisition Costs (“CAC”) of $65 in 2018 and Post-Acquisition Value (“PAV”) of approximately $300 per customer acquired.
- Profitable customer economics: 36% IRR, 4-year payback, and PAV/CAC of 4.5x for new customers in 2018.
- A customer-based valuation of $3.7 billion, 74% lower than Chewy’s current market value of $14.3 billion. The valuation result is driven by insufficient contribution margin from Chewy’s current and future customers to offset fixed costs and drive meaningful profit on an NPV-basis.
Contents
- The Data
- The Model
- Results
- 1) Customer acquisition and active customers to grow at slowing rate
- 2) Chewy has hit the inflection point on the adoption S-curve
- 3) Blended churn rate of 33% in 2018 to decline over time as long tails kick in
- 4) Customer Acquisition Cost (“CAC”) of $65 in 2018
- 5) Post-Acquisition Value (“PAV”) of approximately $300
- 6) Profitable economics, but on a deteriorating trend
- 7) Valuation of $3.7 billion ($8.60 per share)
- 8) Difficult to justify current share price any way you look at it
- 9) Ways in which Chewy can improve its customer acquisition, retention, spend, and profitability
- Conclusions
The Data
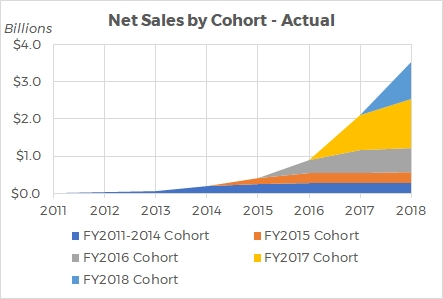
Chewy includes one of the most informative charts in its S-1 filing: Annual Net Sales by Cohort, also known as “C3” or “Customer-Cohort-Chart”. This chart is useful on its own as it shows the annual revenue generated by each cohort of customers over time. In Chewy’s case, net sales for each cohort is flat-to-increasing over time – meaning that growth in net sales per customer is more than offsetting customer churn. This dynamic is the building block of Chewy’s stellar growth to date: while Chewy needs to keep acquiring new customers, its existing customers are providing “embedded” revenue growth of over 20% per year.
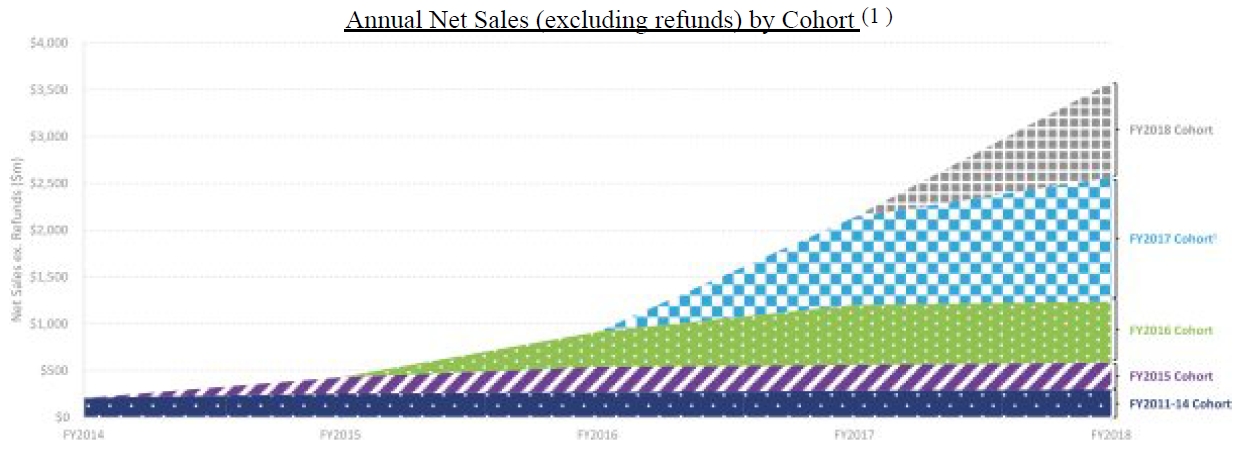
The drawback with the C3 chart is that it co-mingles two processes: number of active customers (retention) and spend per customer. Thankfully, Chewy provides a second useful chart: Net Sales per Active Customer by Cohort.
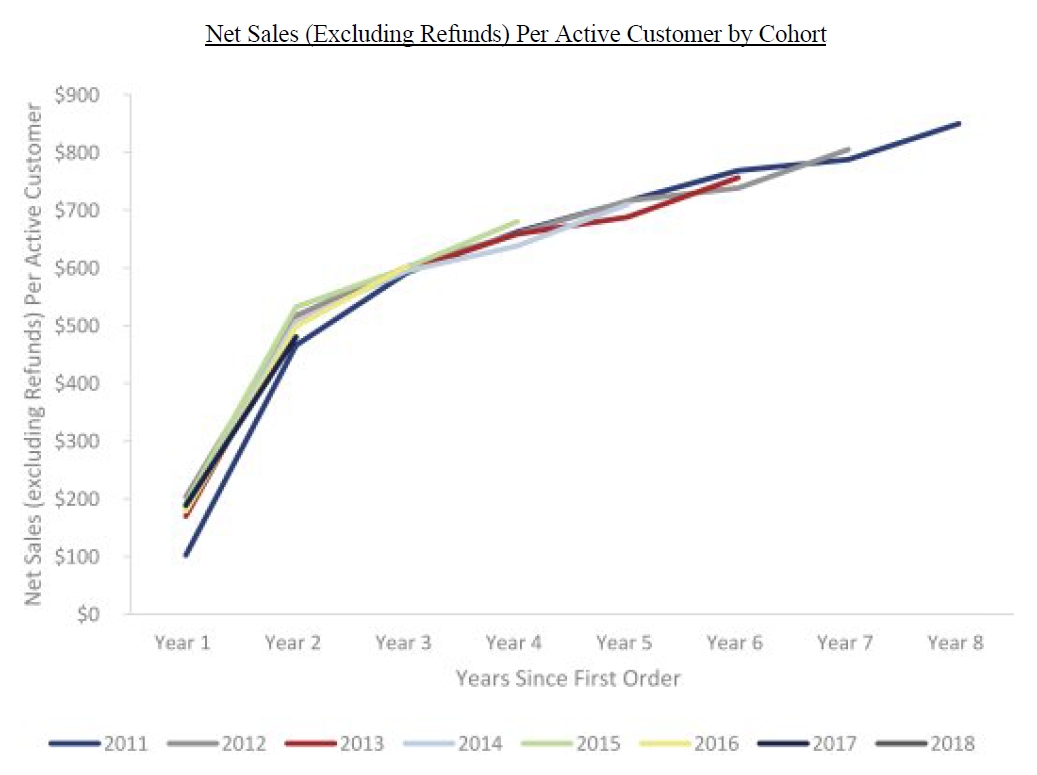
The above chart shows an impressive increase in spend per active customer the longer a cohort exists, although it is important to realize the increase over time is at least in part because customers who churn in any given year will presumably have lower average spend than those who stay. Nonetheless, the average active customer across the cohorts is spending $503 in year 2 (the first full year as a customer), increasing to $711 in year 5 – a clear indication of increasing spend per customer given the retention curve flattens out after the first couple years. This is also reflected in the C3 chart above with increasing total net sales per cohort over time.
More importantly, with the two above charts from Chewy’s S-1 filing, along with select line-item disclosure, we can model the entire customer acquisition and retention process for Chewy on a cohort-by-cohort basis.
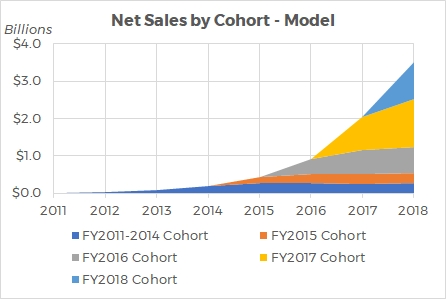
Note: all the charts to follow are a result of our analysis. “Actual” refers to information both explicitly and implicitly disclosed by Chewy. Some of these datapoints and calculations are approximations. “Model” refers to the probability models we fit to the data.
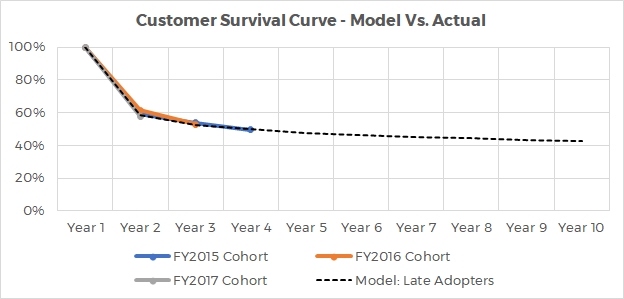
The first analysis we can do is to transform explicit disclosure into implicit information on customer acquisition and survival curves for recent cohorts.
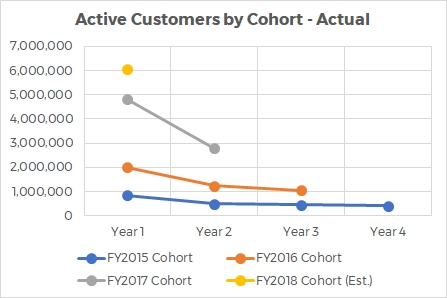
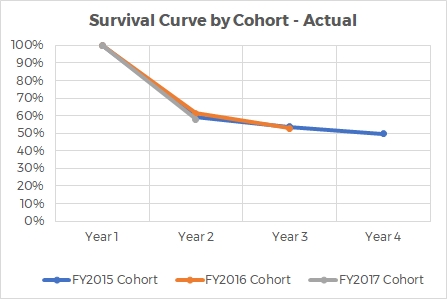
Approximately 40% of new customers acquired in the 2015-2017 cohorts churn in the year following first purchase. The survival curve flattens out quickly with approximately 53% of customers active in year 3 and 50% active in year 4.
The Model
Utilizing probability models and methodology based on Customer-Based Corporate Valuation (SSRN), we model the three key processes of customer behavior: 1) acquisition; 2) retention; and 3) spend. We apply statistical models for these processes to build up to a cohort level analysis.
The model parameters are estimated based on the actual data discussed in the prior section. The resulting model fits to observed data well:
Results
After capturing the underlying customer behavior in a model, we can perform interesting analysis and make projections into the future. Here are the key insights:
1) Customer acquisition and active customers to grow at slowing rate
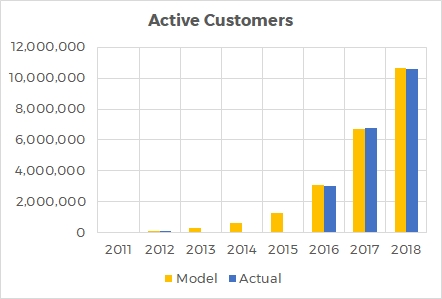
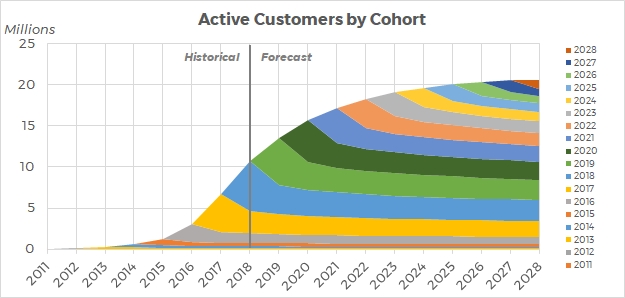
According to the US census and APPA’s national survey of pet ownership, there are approximately 85.5 million pet households in the US. From 2011 to 2018, we compute that Chewy acquired 14.5 million cumulative customers, of which 3.9 million have churned, resulting in active customers of 10.6 million (12.4% of pet households) in 2018. Our model projects Chewy’s active customers as a percent of US pet households to increase from 12.4% in 2018 to 21.5% in 2023, equating to approximately 19 million customers.
In the short term, active customers is projected to grow meaningfully to 13.5 million in 2019 and 15.7 million in 2020. Our model results in single-digit growth thereafter.
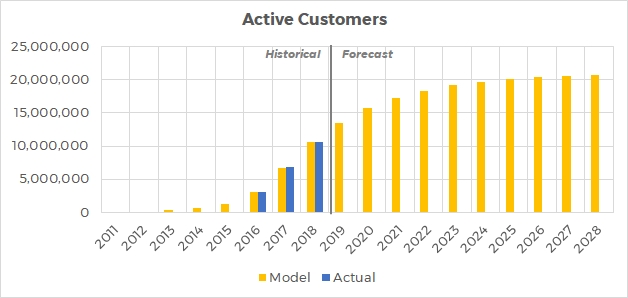
The model’s output of 13.5 million active customers for 2019 can be validated against data included in Chewy’s S-1 which reveals active customers at the end of Q1’2019 of 11.3 million, an increase from 10.6 million at the end of 2018. The simple proportion of Q1 active customers relative to year-end active customers for 2018 would imply 13.3 million active customers at the end of 2019.
We also note that Chewy’s guidance for 2019 net sales is below our model’s projection, which provides further comfort that our estimate of active customer growth in 2019 is not too low.
2) Chewy has hit the inflection point on the adoption S-curve
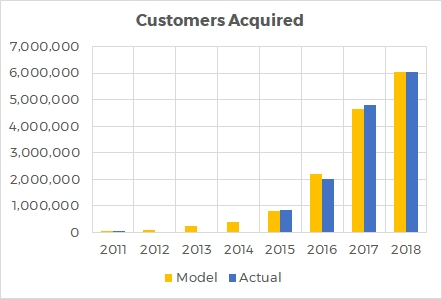
Chewy acquired an impressive 6.0 million new customers in 2018 after adding 4.8 million in 2017. Customer acquisition has likely peaked as our model projects 5.7 million new customers in 2019 despite an estimated $473 million of marketing spend compared to $393 million in 2018. This dynamic continues over time as Chewy captures more of the market and moves beyond the inflection point on the adoption S-curve (still growing but fewer and fewer new customers added each year).
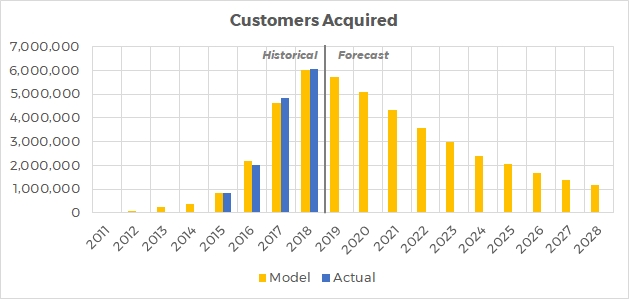
Our $473 million estimate for marketing spend in 2019 is reasonable based on Q1’2019 actual marketing spend of $102 million. If Chewy spends at the same pace as 2018, 2019 marketing spend would equate to $465 million.
3) Blended churn rate of 33% in 2018 to decline over time as long tails kick in
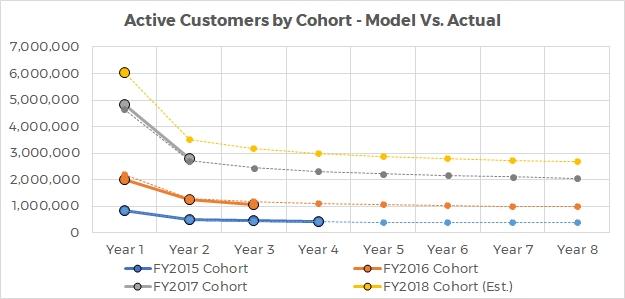
As outlined earlier, the survival curve of each cohort flattens out after an initial steep decline. 40% of new customers churn in the second year but the rest are relatively sticky thereafter with only 10% of those surviving customers churning in the third year, and then only 6% of those surviving customers leaving in the fourth year. Assuming the survival curve for future cohorts are similar to recent cohorts, this leads to a stable base of customers as shown here:
With rapid growth in the last few years, the proportion of Chewy’s customer base that are newly acquired is relatively high. On an aggregate (blended) basis, the percentage of active customers that Chewy loses in recent years has been 30%-35%. This means that, for example, in 2018 Chewy lost 2.3 million of the 6.8 million active customers it had at the beginning of the year.
The deceleration in customers acquired, combined with the long tails of each cohort building up over time, means that Chewy’s customer base will become more mature with a decreasing blended churn rate. We estimate Chewy’s churn rate to fall to 27% in 2019 and 22% in 2020. In other words, fewer and fewer new customers are needed each year to keep its customer base growing.
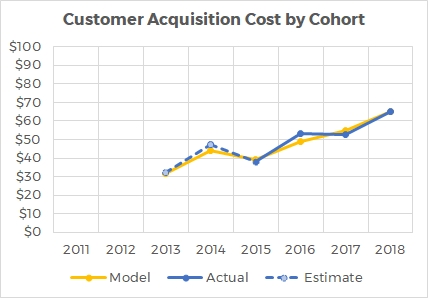
4) Customer Acquisition Cost (“CAC”) of $65 in 2018
Chewy spent $393 million on marketing in 2018, resulting in approximately 6 million new customers. This equates to $65 per new customer acquired. This compares to $53 in both 2016 and 2017, and $38 in 2015. While this is an upward trend, for context, in 2015 Chewy spent just $32 million on marketing to acquire approximately 850k new customers. It is remarkable that Chewy was able to acquire 7x as many customers in 2018 versus 2015 with only a relatively small increase in CAC.
Note: We include all marketing spend in our calculation of CAC for simplicity, even though some marketing may actually target existing customers. This provides consistency and is somewhat balanced by our post-acquisition value calculation not including any marketing expense. This calculation may overstate CAC (as well as PAV), especially in later years as an increasing portion of Chewy’s marketing spend will be attributable to retaining current customers, rather than new customer acquisition.
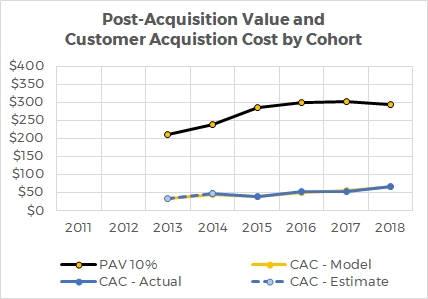
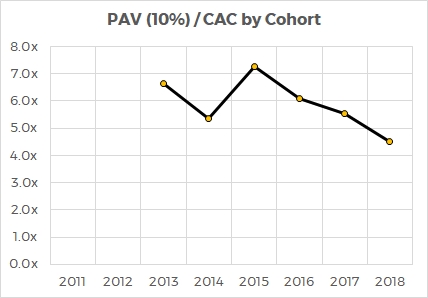
5) Post-Acquisition Value (“PAV”) of approximately $300
The customers Chewy is acquiring are profitable with Post-Acquisition Value of approximately $300 per acquired customer. The following chart shows that even with increasing CAC, Chewy is acquiring customers profitably.
The calculation of PAV includes the following assumptions:
- 10% discount rate. We calculate a WACC of 9.5% but round up for simplicity.
- Retention curve as outlined above with approximately 60% of customers in each cohort surviving after one year and a long tail around 40%.
- Contribution Margin of 9.6% post-2018:
- COGS = 77% of revenue. This compares to 79.8% in 2018 and 82.5% in 2017.
- Fulfillment costs = 9.3% of revenue. In-line with 2016-2018.
- Merchant processing fees = 2.1%. In-line with 2016-2018.
- Variable “other” SG&A = 2.0%. We assume that other SG&A, which includes stock-based compensation and other items not otherwise categorized has a fixed and variable component with a simplistic assumption that 2% is the variable component. We account for the fixed portion separately.
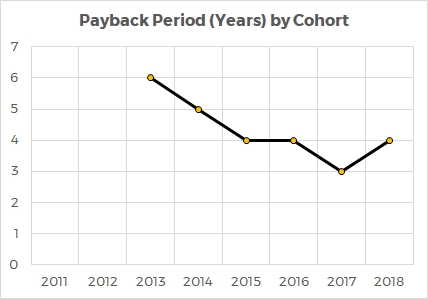
6) Profitable economics, but on a deteriorating trend
Chewy has been acquiring customers profitably in recent years with PAV/CAC > 4.5x, IRR’s of 30%-45% and payback periods of 3-4 years. Long customer lifetimes and increasing spend over time are key to Chewy’s profitability.
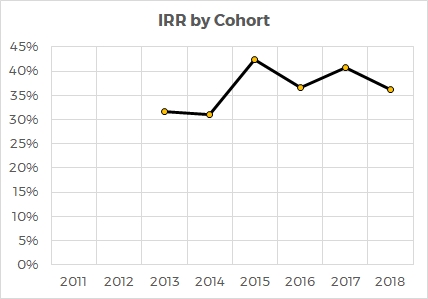
Looking ahead, CAC is expected to increase as customer acquisition decelerates and marketing spend increases, resulting in a deteriorating trend in customer economics going forward. This would be the case even if attributing a portion of marketing spend to retention rather than all to acquisition.
The underlying cause of declining economics is not entirely marketing spend itself becoming less effective; rather it is a function of the underlying customer propensity to adopt and the point of the adoption curve that Chewy finds itself on. Put simply, Chewy has already acquired a large portion of likely customers and there are fewer and fewer left to acquire. At the same time, Chewy is becoming larger and marketing spend will continue to rise on an absolute basis. Our model assumes marketing spend increases on an absolute basis but steadily decreases as a percentage of revenue.
Under the assumptions in the model, economics in 2019 remain healthy at >30% IRR and 4-year payback. Thereafter, each subsequent cohort is acquired with longer payback periods and lower IRR’s.
7) Valuation of $3.7 billion ($8.60 per share)
Chewy’s IPO price was $22 per share, equating to a $9.3 billion valuation. Chewy’s stock has since traded in the $30-$35 range with a recent close of $33.75, equating to an incredible $14.3 billion market cap.
Our valuation methodology takes the calibrated model and rolls it forward to project retention of Chewy’s current customer base, new customers added and retained over time, the cost to acquire new customers, spend per customer, variable costs, and fixed costs over time. It is a discounted cashflow (“DCF”) style analysis, differentiated by statistical modeling of customer behavior on a granular level to build up a robust projection into the future.
Key assumptions in the valuation model:
- US household growth of 0.8% per year and consistent pet ownership (67% of households)
- No international expansion outside of the US.
- Marketing spend increases in absolute dollar terms but decreases as a percentage of revenue, falling from 11.1% in 2018 to a minimum of 3% over time. This is consistent with Chewy’s outlook in its S-1.
- Capital expenditures = depreciation and amortization
- Spend per active customer over time follows similar trajectory as past cohorts
- Retention curves for future cohorts are consistent with recent cohort retention curves
- 10% cost of capital. We calculate a WACC of 9.5% and round up for simplicity.
Using this customer-based approach, we arrive at a fair valuation for Chewy of $3.7 billion, 74% below its current market cap of $14.3 billion.
The key components of this valuation are remaining value of current customers, the cost and PAV of new customers yet to be acquired, and the NPV of fixed costs:
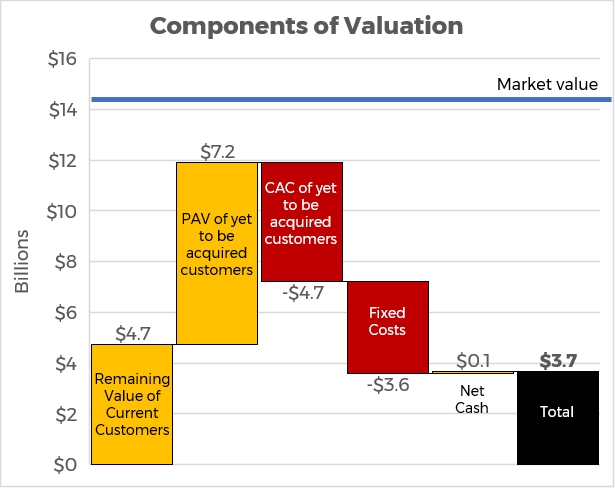
Drivers of the valuation include:
- Low margins. As a product retailer (as opposed to a software or services company), Chewy’s gross margins are relatively low at just 23%, providing little room to cover fixed costs, let alone profit after accounting for other variable expenses such as fulfillment costs (9.3%) and merchant processing fees (2.1%).
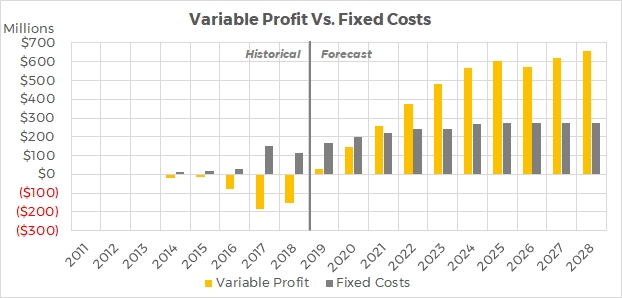
- Low variable profit relative to fixed costs. Plotting variable profit (including marketing expense and taxes that kick-in around 2024 after tax pools are exhausted) against expected fixed costs shows that Chewy turns profitable in 2021. However, the wedge of profitability post-breakeven is not enough to drive a valuation anywhere close to Chewy’s current market cap.
8) Difficult to justify current share price any way you look at it
$3.7 billion in our model versus $14.3 billion of market value is obviously a large gap. While we believe the projections and assumptions behind our model are reasonable, there are of course a wide range of possible outcomes for the future. What would it take for the current market cap of $14.3 billion to be justified?
- Discount rate. A 1% discount rate would reconcile to the $14.3 billion valuation.
- Contribution margin. As noted above, we model Chewy’s contribution margin at 9.6%. If Chewy were able to immediately increase its contribution margin to 18%, the current stock price would be justified. With COGS comprising 77% of revenue, this would likely need to be the primarily source of margin expansion.
- CAC. If Chewy were able to spend zero dollars on marketing going forward without any impact on customer acquisition or retention, the value of Chewy would still only be $9.5 billion.
- Customer acquisition. If Chewy were magically able to acquire unlimited new customers at 2018 economics (CLV of $228) with no impact on fixed costs, it would need 58 million new customers to justify the current share price. For context, Chewy had 10.6 million customers at the end of 2018 and there are approximately 85 million pet households in the US.
- Customer retention. Even if Chewy were to never lose a customer again, our model only gets to $9.0 billion in value.
All these scenarios are unrealistic, with margin improvement the most plausible (over time). It is difficult to find any way to justify or rationally explain the market’s valuation of Chewy, except to say that this is a fast-growing company with a recognizable brand going public in a hot market. Counter-intuitively, the fact that Chewy currently has negative earnings and negative cash flow likely helps its valuation – without something to base valuation on, the market’s optimism has no anchor to tie it down.
9) Ways in which Chewy can improve its customer acquisition, retention, spend, and profitability
Priority #1: Margin improvement
Chewy has negative earnings and negative free cash flow, despite having achieved impressive scale with 11.3 million active customers. Chewy’s cost structure is primarily variable with COGS at 77% of revenue, fulfillment costs of 9.3%, and merchant processing of 2.1%.
Chewy’s variable margin is insufficient to cover fixed costs and generate meaningful profit, even at significant scale. Its breakeven is approximately 17 million customers, a level it is not expected to achieve until 2021, and significantly above its current level of 11.3 million active customers.
It is thus vital that Chewy improves profitability. COGS at 77% in Q1’2019 (and our assumption going forward) is an improvement over 79.8% in 2018 and 82.5% in 2017. While there is a floor on how low COGS can go given Chewy is primarily a retailer of third-party products, it is possible to improve. Every percentage point is meaningful: a 1% improvement in variable margin equates to a $1.2 billion increase in equity value.
Focus on private-label sales
As an internet retailer, Chewy is in an optimal position to sell its own private brand products. The benefits are obvious: 1) higher margins, 2) priority placement and promotion; 3) use of data to create optimal product offering.
While it must not alienate its third-party brands, other marketplaces and retailers such as Amazon, Target, Walmart, Bed Bath & Beyond, and Kroger have demonstrated it is possible to grow private-brand sales while continuing to sell third-party brands.
In late 2016, Chewy launched a hardgoods brand, Frisco, followed by two consumable brands, American Journey and Tylee’s, in 2017. It just started selling its brands in PetSmart stores in late-2018. Chewy’s Private brand sales comprised 5.3% of net sales in 2018, an increase from 3.8% in 2017. Chewy believes private brand sales can get to 15% of net sales over time. Accelerating this initiative should be a priority to increase margins.
Increase customer spend by expanding product offering
The US pet market is approximately $70 billion, however Chewy only serves the pet food ($29 billion) and some of the supplies and OTC medicine ($15 billion) segments. Further, online sales comprise only 14% of the food and supplies market, according to Chewy’s S-1.
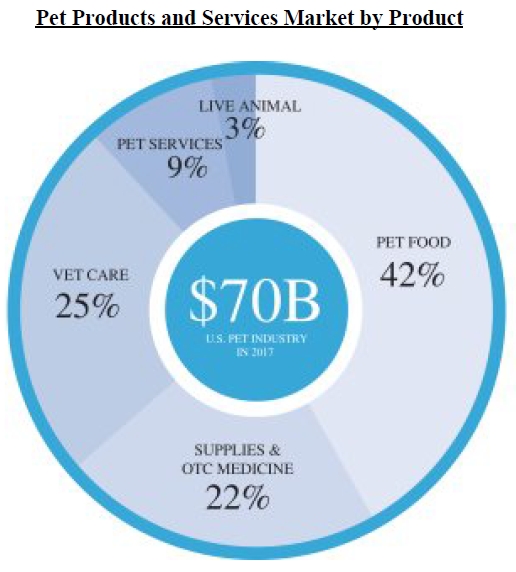
Source: Chewy's S-1 Filing
Chewy has a long runway of growth ahead and should focus on capturing more of the US pet consumables and supplies markets. At the same time, Chewy should be thinking ahead and expand its product offering. Indeed, Chewy recently launched its online pharmacy business, although it is in the early stages and is competing with veterinarian offices, offline retailers, and PetMed Express.
Long-term, Chewy is in a unique position to become something more than an online retailer. Insurance is growing market. Pet care (walking, daycare, etc.) is a large and fragmented market with low customer satisfaction. Rover, valued at almost $1 billion last year, is a leader in pet care, along with Wag (funded by SoftBank). There are numerous opportunities both online and offline for Chewy to expand into other areas organically or via acquisitions.
Improving retention
Chewy’s focus on delighting customers through exceptional customer service, hand-written cards, pet portraits, and other initiatives has created a customer base with long-term loyal customers. This customer-centric strategy is key to Chewy acquiring and keeping customers. With payback periods of 3-4 years on new customer acquisition, it is vital customers stick around long enough to turn profitable and generate meaningful returns.
For Chewy, customer service is not enough – low prices and fast/free shipping are also crucial, especially considering Amazon is competing with Chewy on all dimensions. Chewy already offers low prices and is currently engaging in a summer sale with significant discounts to compete with Amazon. Importantly, Amazon has free shipping whereas Chewy only offers free shipping on orders over $49.
While Chewy is rightfully concerned about profitability on each transaction and there is undoubtedly some positive effect from customers adding more to an order just to meet the minimum threshold, there will also be some customers who shift all or some of their buying to Amazon because of free shipping. Depending on how this delicate balance shifts over time, Chewy may need to reduce its free-shipping minimum to improve retention rates.
Expand internationally
Chewy has no stated plans to expand internationally and does not appear to be in a rush to do so. At this stage in the company’s growth, it makes sense to be focused on capturing the US opportunity and executing operationally before making a foray into other markets. Our model assumes no international expansion, or effectively that any such expansion would add zero NPV in the foreseeable future. Canada is a logical next step, although the market in Europe is more sizable opportunity. For now, there is a long runway of growth in the US.
Conclusions
This analysis paints a compelling story of continued active customer growth and positive economics on new customer acquisition. However, the customer-level economics are insufficient to generate profits at the company’s current level of scale. On an NPV basis, the value of Chewy’s current and future customers points to a valuation significantly below its value in the public market.
These insights are the result of probability models fit to the historical acquisition, retention, and spend of Chewy’s customer cohorts. The projections into the future assume the basic assumptions and processes of customer behavior continue. In that sense, the projections are probabilistic view of Chewy’s future based on what can be observed today. However, there are strategic moves that Chewy can make to change the assumptions and customer processes, potentially resulting in better (or worse) outcomes for its business and valuation.
-
McCarthy, Daniel and Fader, Peter, Customer-Based Corporate Valuation for Publicly Traded Non-Contractual Firms (March 9, 2018). Available at SSRN: https://ssrn.com/abstract=3040422 ↩
Disclaimer: This post is strictly for informational purposes only and should not be construed as investment advice or a recommendation to buy or sell any security. The views expressed herein are the author's alone and do not represent views of any organization or employer the author is currently or was previously associated with. Click here for full disclaimer.